Crash Remedies: The Road to Traffic Safety
By Fanis Grammenos and Tom Kerwin
Recent literature on urban planning approaches emphasizes citizen health and with good reason: it was the unhealthy city conditions that frequently decimated city populations in previous centuries that gave birth to the planning profession in the late 1800s; health became its cause célèbre.
In time, one by one, causes or vectors of ill health or death have been identified and city life emerged healthier, often surpassing living in the country, which city dwellers always considered ideal.
Traffic crashes, the subject of this article, are one cause of ill health, impaired living or curtailed lifespan. Here we would like to examine the often cited factor of urban form, and its effect on crashes, or, more specifically, to determine whether city growth, in its sprawl-type outward expansion, has increased the incidence of fatal and injurious crashes. This factor is a relatively recent addition to numerous attempts to pin a correlation or causality linking traffic accidents and any number of causes.
Crashes, fatal and injurious, currently constitute a large social burden. In Australia, for example, calculations show that the total social costs of crashes was 17.85 billion or 1.7% of the GDP in 2006(1).
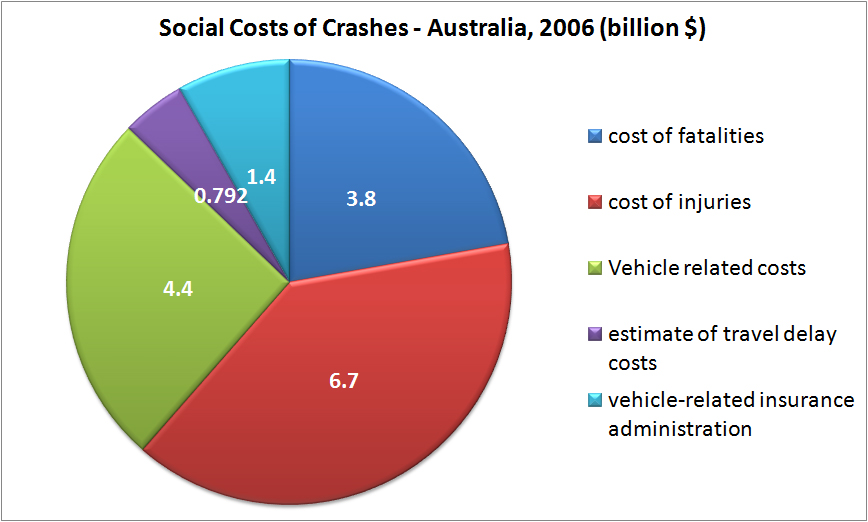
Graph 1. Source: Tim Risbey et al, The Social Costs of Road Crashes ATRF 2010 proceedings. (Chart by author)
Some context first: The 20th century is not the only time in city evolution at which traffic accidents became a concern. Around the end of 19th century when all in-city transportation was hoof and foot-dependent, accidents in cities were common.
In New York, for example, 200 persons died in accidents in the year 1900 which, when transposed, means 75% higher per capita rate than today. In Chicago the rate per horse-drawn vehicle in 1916 would be almost seven times the per auto rate in 1997 (2). In London, U.K.the average rate of fatalities between 1865 and 1875 was 123 per year. The number of injuries was about 2,704 – roughly 20 times the death rate. (3).
These are surprising, counter-intuitive statistics: the two cities, as all others at the time, were not just walkable, they were predominantly foot-based cities; exemplars of urbanism. No person had to cross six-lane arterials or dodge high-speed vehicles. Distances were short, city blocks small, densities high, and personal daily routine took place mostly on foot. It seems paradoxical that a walkable, dense, mixed-use city would generate high fatality rates; and more so because the speed of traffic ranged between 5 and 15 km /hr: half or less the 30 km/h threshold beyond which fatalities increase. Without sidetracking for explanations, we can draw at least one simple idea from this past: a dense, foot-based city can generate high rates of fatalities.
The story after
Soon after motorized transport entered city streets, fatal crashes rose. Until hoofs left the streets permanently, there was a troublesome mix of modes with variable speeds, reliability and behaviour: Cars, were mechanically unsafe; horses, subject to fear, tantrums or sudden collapse; electric trams, to stalling; and pedestrians, to darting across streets at any convenient point.
All these elements made a recipe for traffic "bedlam" and, inevitably, fatal and injurious crashes; streets morphed into a "human slaughterhouse"; a situation akin to the city streets of developing nations today that register two to ten times the average traffic accident rate of industrialized nations. Innovations generally require a certain period of adjustment.
In the face of appalling and rising death figures, many adjustments occurred in this early 30-year period. None of these changes involved urban form; they were inevitably operational and regulatory (e.g. lane markers, stop signs and driving rules).
Even if urban form changes had been deemed necessary, they would invariably be slow to introduce into an existing, fully built-up district, if at all; its layout, its buildings and land uses predated the car by decades if not centuries.
Graph 2 traces the change in fatalities with respect to vehicle miles traveled (VMTs). It shows that in the U. S. during the first decades of automobile's presence on city streets car accident rates fell rapidly even though car travel tripled between 1920 to 1955.
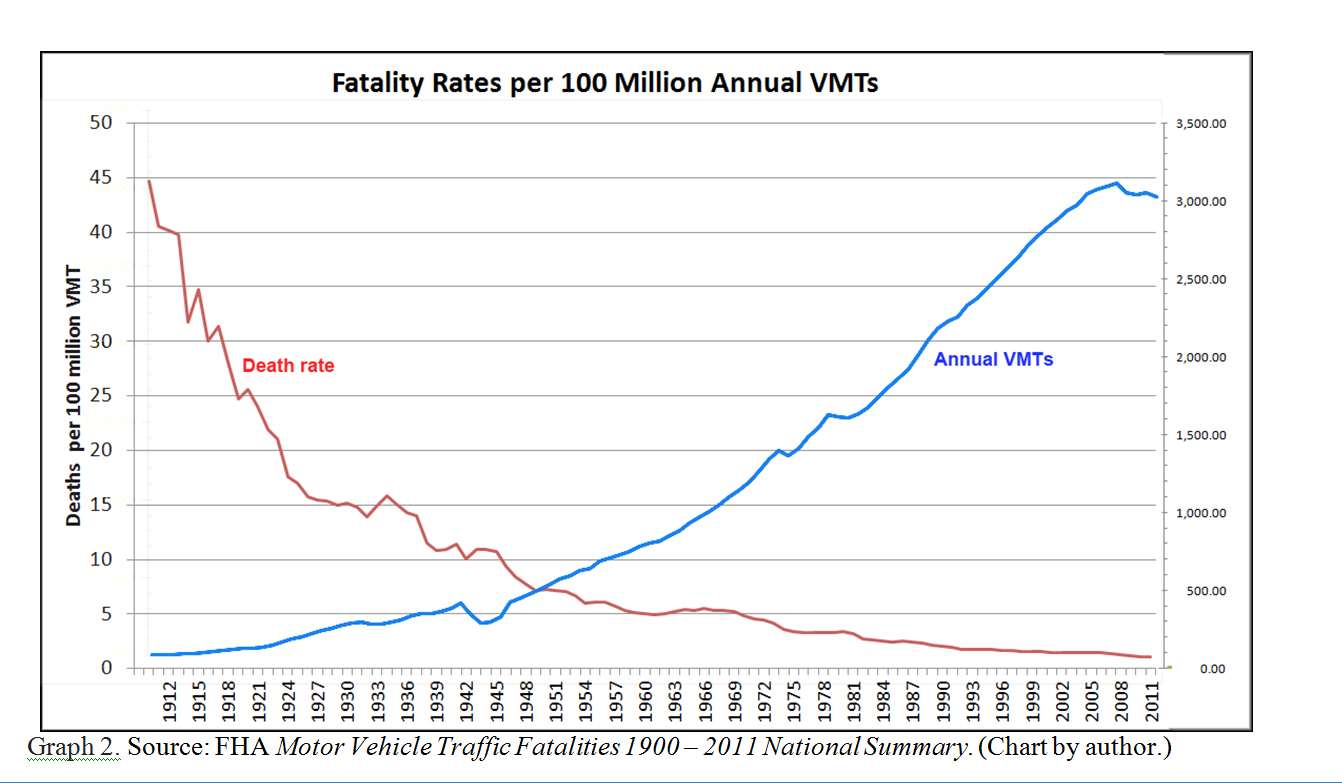
During the same period the urban form characteristics remained fairly stable:
a) The modest suburban expansion of cities at that time was light-rail dependent; "motopia" had yet to emerge; and b) most urban form of the '30s and '40s was generally similar to the early 20th century prototypes: medium to high density compact development around a rail line or station with a core of amenities and services. If this form did play a role in the drop in fatalities it is nearly impossible to determine due to the absence of concurrent alternative forms. When new "motopia" forms emerged, trends in fatalities do not bear out its influence, as we shall see below.
The '50s explosion and subsequent expansion
Eventually, the covert war on light rail ended with the victory of the automobile. When its dominance was firmly established and new highways opened vast tracts of land for city growth, urban form at the city periphery changed decisively from compact, mixed use, walkable and transit-centered to typical "motopia" or "sprawl".
A recent paper (4) has posited a correlation between sprawl and an increase in fatal accidents and a small decrease in injuries. Contrary to this theoretical contention, however, the traffic fatality rate actually decreased asU.S.cities sprawled and total VMTs increased.
The current level of traffic fatalities stands at about one third of the 1955 level and less than 1/20 of the 1925 rate. Intriguingly, sprawl at the national scale did not produce an increase in fatal or total crashes as analysts predict. If the sprawl paradigm did play its negative role, then other countervailing factors must have had a greater influence that overshadowed its effect.
Turning toCanada, also a "suburban nation" as documented (5), we look at the fatality and injury trends at the national, provincial, and city level for a progressively finer grain picture.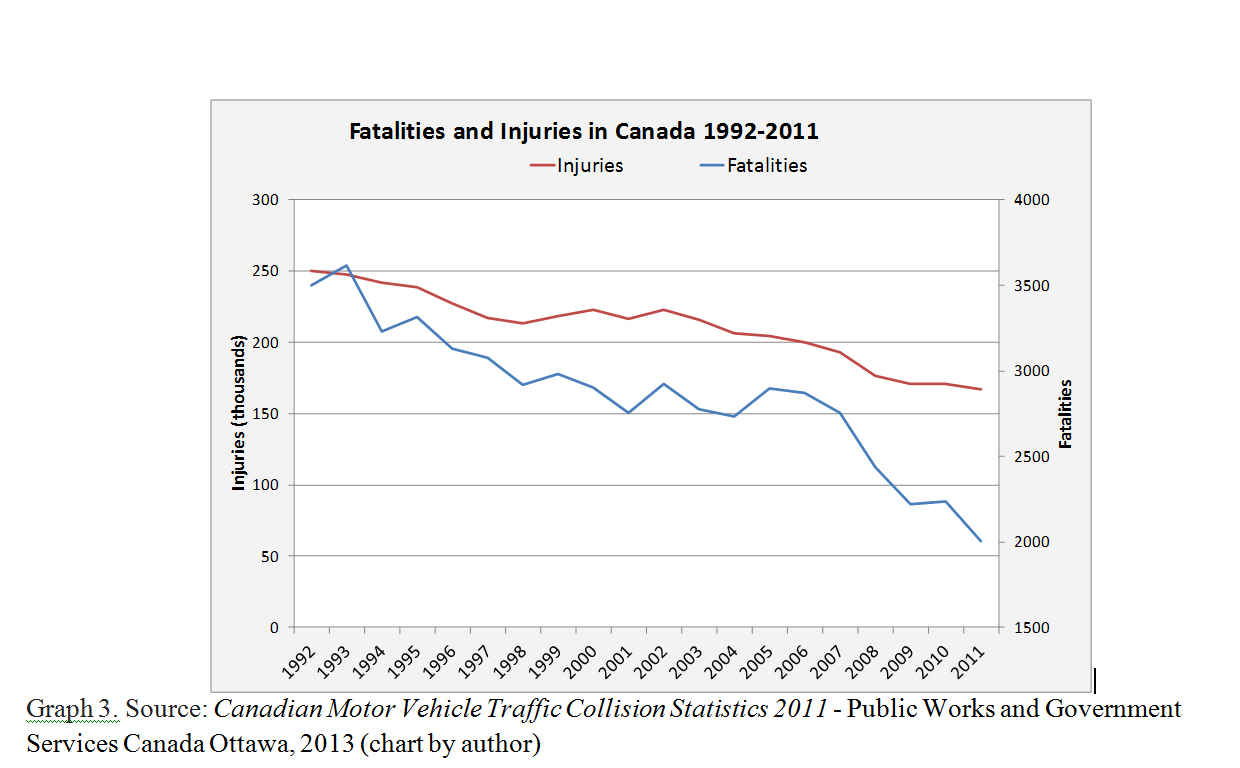
The national trends inCanada mirror those of theU.S., as can be seen in the above graph that spans the period between 1992 to 2011. Notably, fatal crashes fell at a faster rate than injuries, increasing the uncertainty about the correlation that links a substantial rise in fatalities with a rise in "sprawl-ness".
Provincial statistics show similar trends. The chart below shows the trends inOntario, the most populous Canadian province:
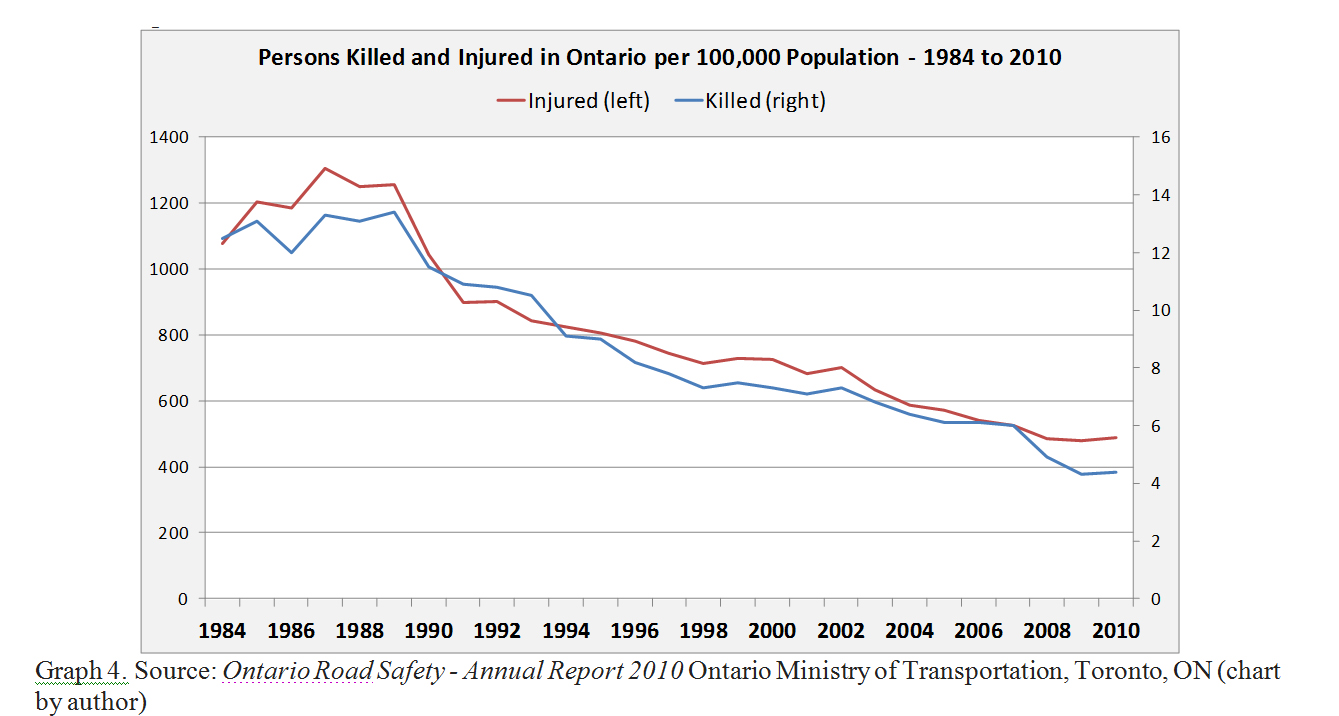
During a quarter century of more suburban expansion, fatalities and injuries followed a similar decline for a respective drop of around 70% in fatalities and about 60% in injuries; a substantial change. Statistics of a group of six provinces, for a shorter period of five years, also show a downward trend with only one anomalous, outlier spike.
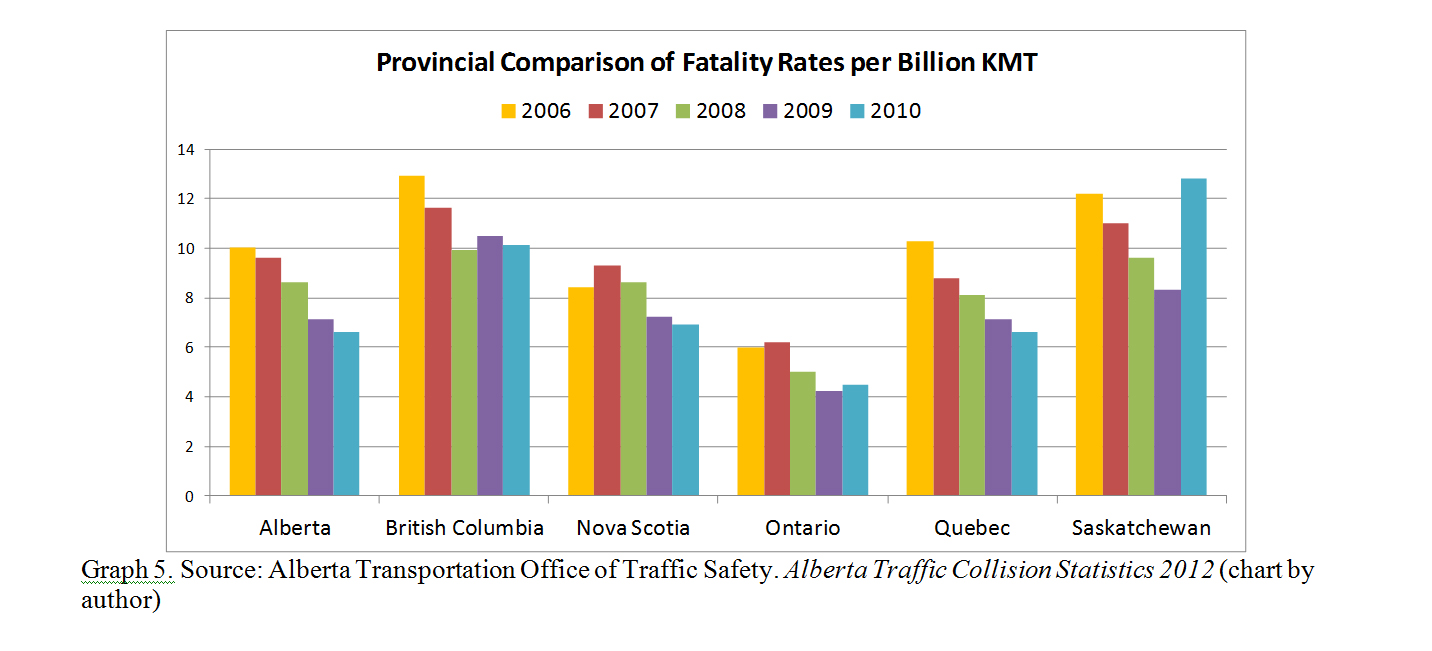
Just as the national level statistics, provincial ones reinforce the uncertainty about a correlation between urban form and traffic fatality rates; instead of upward climb, we see an unmistakable decline.
The Case of Denmark
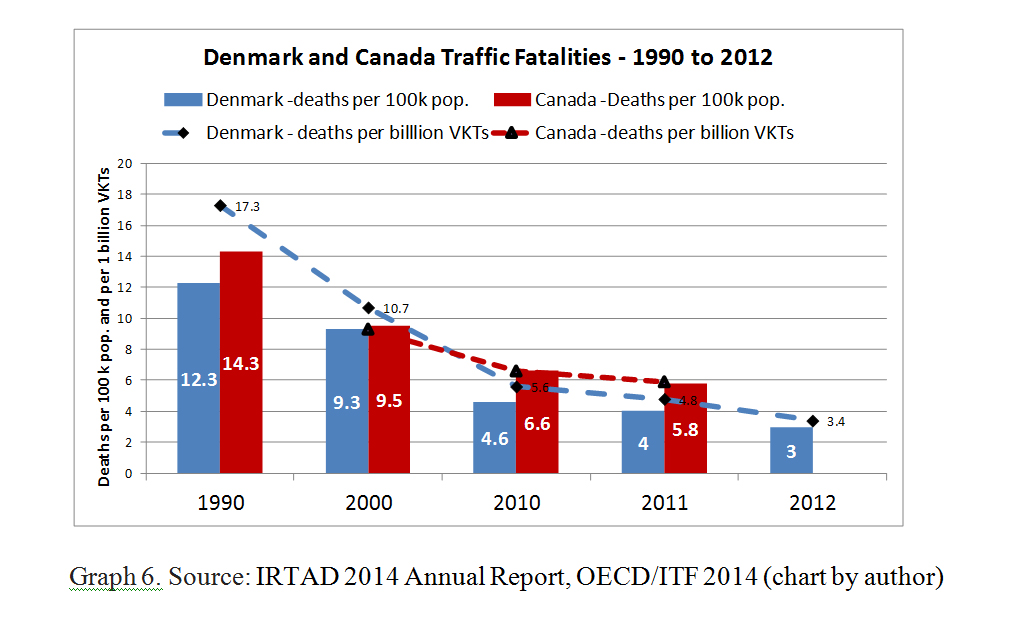
We often look to other nations for examples of good urban form and its effect on transportation choices. Statistics of where the rest of the OECD nations stand on traffic fatality rates can be instructive. According to a Transport Canada report (6), in 2008, four countries had the highest levels of fatalities, Denmark occupying the topmost place followed by the US, France and Canada.
On closer examination, this unexpected top position proves to be simply a blip in a trend that shows a steady decline. Between the 2006 and 2008 Denmark experienced a sharp increase in fatalities but returning to the 2006 level in 2009 and continuing the downward trend afterwards. (7)
But what do statistics show at the finer, city scale?
We turn to two – Toronto and Calgary – of six Canadian cities whose sprawl has been documented in detail (8,9). This research used four well-established parameters and twelve criteria on progress toward compact, walkable urban form and tested city achievements on the ground against them. With the exception of one, all six cities failed to advance and, surprisingly, in spite of their anti-sprawl policies, in most the movement was retrograde toward more sprawl. Knowing that sprawl went unchecked, it is instructive to look at their progress on reducing fatalities and injuries.
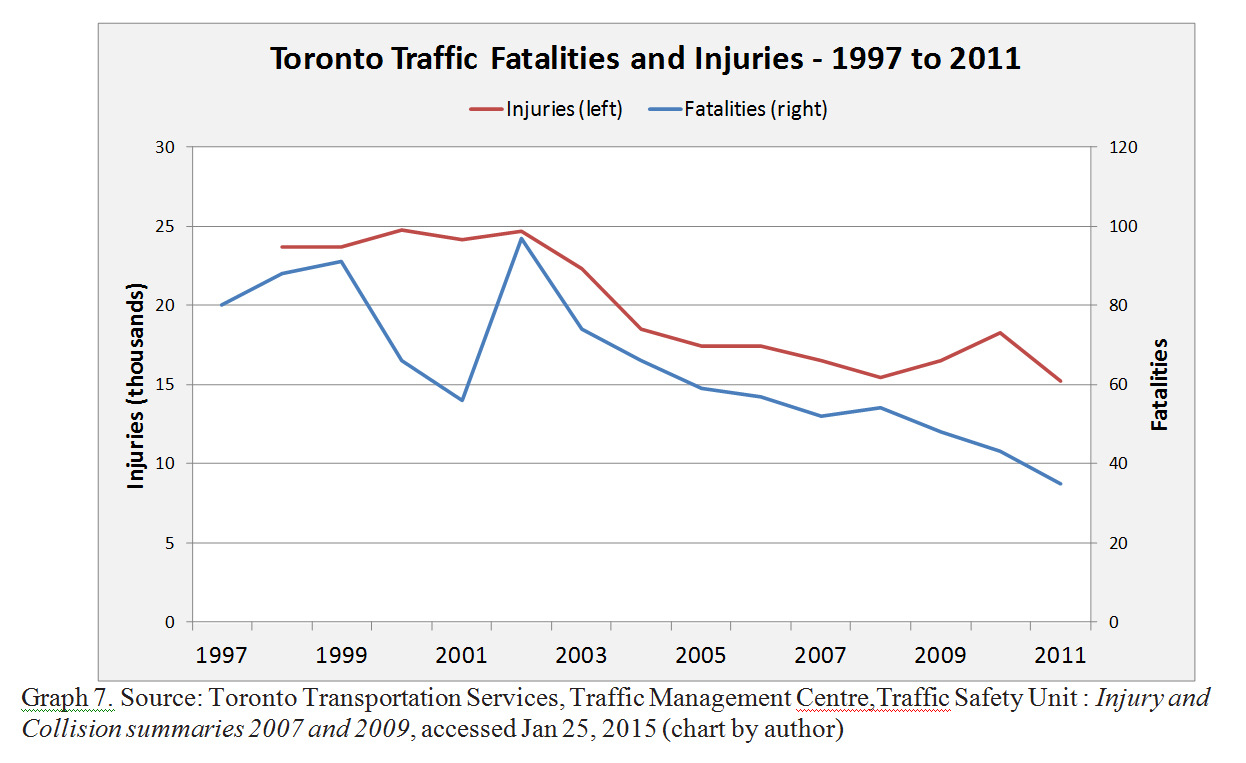
Graph 6 shows the trend in fatal crashes and injuries for the period 1997 to 2011. Toronto during these 15 years can be characterized as a suburbanized region (with a few exurban appendices) that continues to expand using the conventional development model.
Calgary, Alberta, the "car capital of Canada", according to the Smart Growth report (8) has the lowest overall density and has made little progress on its urban form goals between 1981 and 2005. It remains a sprawled city.
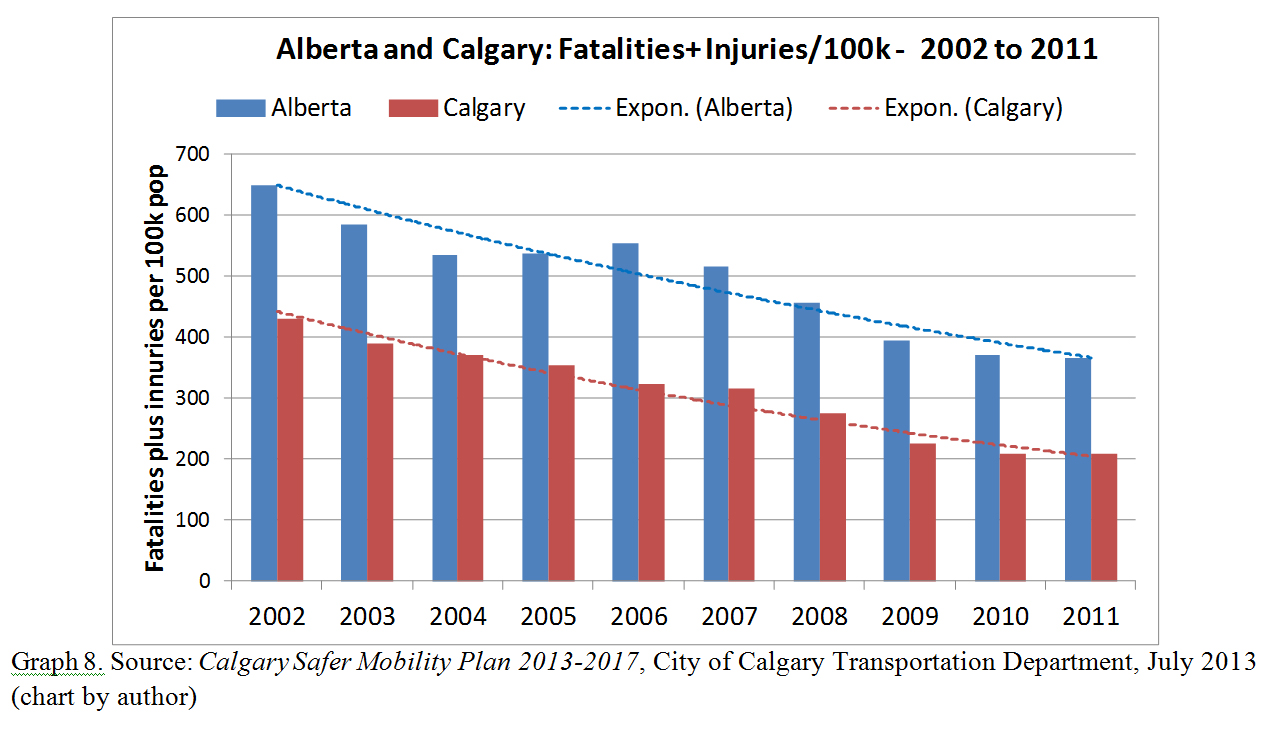
As with the national and provincial trends, the two cities' traffic safety trends show a persistent overall drop in fatal and injurious accidents (graphs 7 and 8). Once more, the city-level fatalities and injuries trends contradict the correlation that links sprawl-type urban form with an increase in fatal accidents and a decrease in injuries. Whatever the countervailing factors are, they mask and overwhelm an expected rise in fatalities. As for the decrease in injuries, the actual drop is far greater than what the postulated correlation would predict and cannot be explained by it alone.
If at the national, provincial and city levels the trends are positive in spite of the negative direction of urban form, the health concerns that would justify planning interventions appear to have been alleviated on this front, at least for the first century of automobility and for the half century of uninterrupted sprawl.
One might speculate that had growth been in a compact, walkable, diverse use, transit-centered form, fatalities could have declined even faster. This could well be true but cannot be deduced from the above statistics. Regardless, the current trends could not be seen as a cause for concern and urgent action on the urban form front. On strictly health grounds, cities and provinces are progressing in the right direction. There is no apparent imminent or growing threat.
So far we have seen the difficulty of explaining the persistent drop in traffic fatalities via a correlation with "sprawl-ness" and we hypothesized that other factors may be at work. Indeed they are. We find several in overlapping lists of international, national, provincial and city documents: some linked to the causes of fatal crashes, others as government directives. Here is a collection in no particular order of importance.
Speed limit range, control Drinking and driving laws Young driver restrictions Intersection geometry Car crash-worthiness rating
| Car fitness regulations Road condition care Driving fitness, age Speeding penalties Vulnerable User protection
| Motorcycle helmets Seat belt use, air-bags Use of child restraints Pre-hospital, on-spot care Distraction prohibitions |
As one example of the potential effect of safety measures, NHTSA in 2005 (10) estimated that 5,839 lives would have been saved in 2004 (or 14% of total car-related fatalities) if all passengers wore seat belts.
Ideally, to conclude this analysis credibly, each measure should be accompanied by an indicator of effectiveness and linked to specific outcomes. This we leave to specialists. All we need to conclude at this point is that, whatever mix of instruments has been used, it has helped counter the potential of increasing fatality rates, presumed to be resulting from more sprawl.
This article does not question the value of an integrated approach, where planning interventions can have multiple beneficial effects. It simply asserts that on at least one front there is no cause for alarm or a rationale for a call to arms; the battle against traffic fatalities is being won, without urban form change. Nor does it suggest that a correlation between sprawl and the reduction in fatal and injurious crashes exists or imply that sprawl is a desirable urban form.
It simply makes the case that, in view of the positive historic progression at every urban scale, the effect of urban form on crashes cannot be established unequivocally and therefore cannot be a lead driver for action. Other instruments are at work and, evidently, they are producing substantial benefits. The road ahead lies in understanding, pursuing and operationalizing these instruments with diligence.
Note: the authors wish to thank Luis Rodriguez for his detailed and insightful comments on the early drafts.
References
- Tim Risbey et al, The Social Costs of Road Crashes ATRF 2010 proceedings.
- Eric Morris: From Horse Power to Horsepower Access #30 Berkeley, Spring 2007
- J. Thomson, F.R.G.S. and Adolphe Smith. Street Life in London, published by Sampson Low, Marston, Searle,& Rivington London, UK (circa 1880-1890)
- Reid Ewing and Shima Hamidi. Measuring Sprawl 2014. Metropolitan Research Center. Prepared for National Cancer Institute, National Institute of Health. Smart Growth America. Retrieved on Jan 22, 2014
- David L. A. Gordon and Mark Janzen. Suburban Nation? Estimating the Size of Canada's Suburban Population Journal of Architectural and Planning Research. 30.3 (Autumn, 2013) 197. Copyright © 2013, Locke Science Publishing Company, Inc Chicago, IL. U.S.A. Retrieved Jan. 22, 2014, from:http://japr.homestead.com/Gordon_FinalVersion131216.pdf
- Road Safety in Canada March 2011, report published by Transport Canada
- World Health Organization: Global status report on road safety 2013: supporting a decade of action. Geneva 2013 pg 101
- Ray Tomalty, Murtaza Heider and Bartek Komorowski: Progress Towards Smart Growth in Canada - 2012 Assessment a report prepared for Canada Mortgage and Housing Corporation (CMHC), 2012 unpublished. Personal communication with author.
- Smart Growth in Canada: A Report Card. Ray Tomalty and Don Alexander. CMHC Research Highlight. Socio-economic Series 05-036. December 2005. Retrieved on November 22, 2014, from: http://www.cmhc-schl.gc.ca/odpub/pdf/64931.pdf?lang=en
- NHTSA 2005 National Highway Traffic Safety Administration (NHTSA) (2005). Traffic safety facts 2004 data: Occupant protection. Washington, DC: U.S. Department of Transportation Report No. DOT HS 809 909.
Fanis Grammenos heads Urban Pattern Associates (UPA), a planning consultancy. UPA researches and promotes sustainable planning practices including the implementation of the Fused Grid, a new urban network model. Before founding UPA, Fanis had a research career at Canada Mortgage and Housing Corporation. He is a regular columnist for the Canadian Home Builder magazine. He is the author of Remaking the City Street Grid: A model for urban and suburban development - McFarland Publishers 2015. Fanis can be reached at: fanis.grammenos-at-gmail.com.
After 24 years atCanada Mortgage and Housing Corporation, Tom Kerwin now leads an active volunteer life, including being the Science and Environment Coordinator for the Calgary Association of Lifelong Learners. He holds a Master's degree in Environmental Studies from York University.