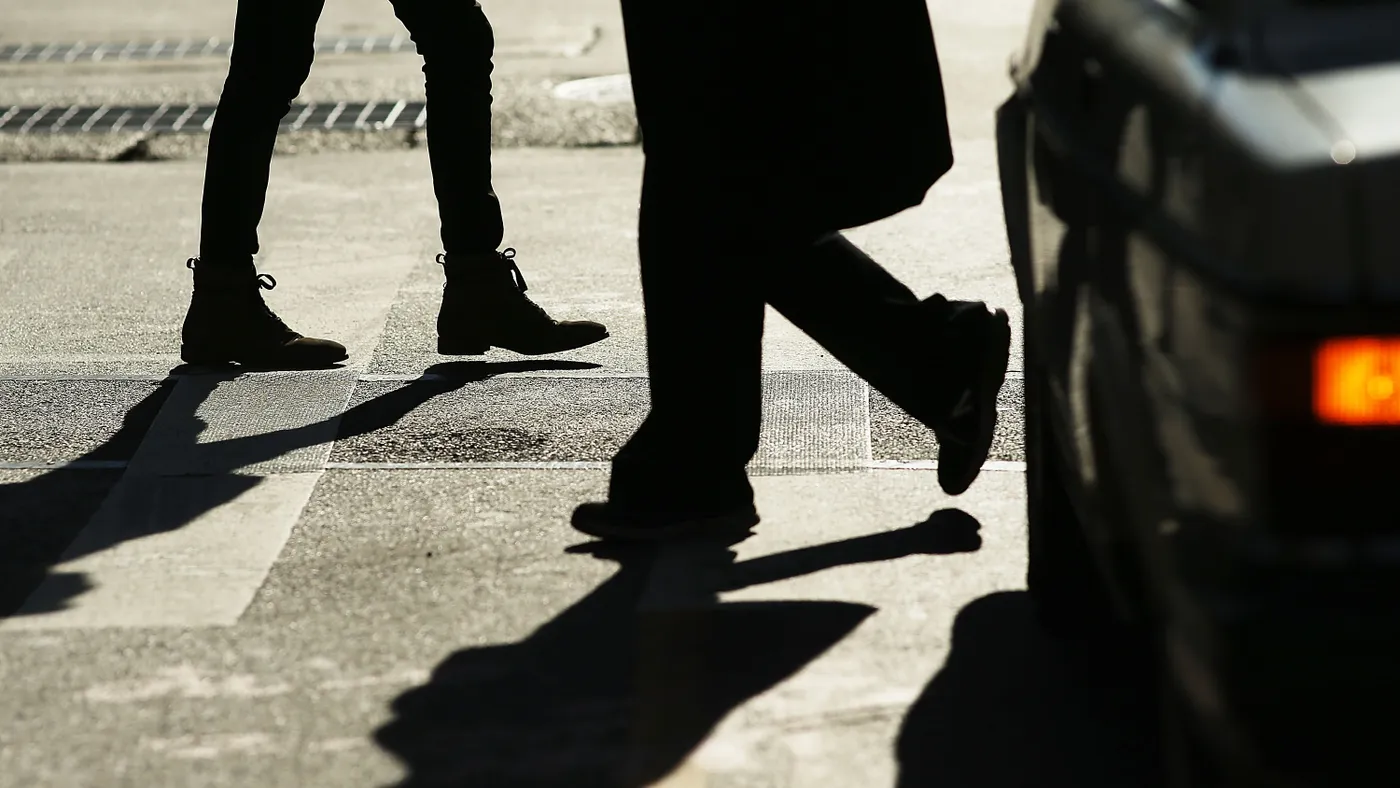
On April 5, 2022, a speeding pickup truck struck a 35-year-old man while he was walking his dog in Houston, making him one of 117 pedestrians killed in that city last year. Eleven days later in Brooklyn, a driver ran a red light and killed a 31-year-old woman in a marked crosswalk near her home. On a spring day in Los Angeles this year, a hit-and-run driver left a 72-year-old man dead in the street. All told, motor vehicles killed more than 7,500 people while they were walking to church, a grocery store, a bus stop or elsewhere in the U.S. last year, according to a June analysis by the Governors Highway Safety Association.
Pedestrian safety — or the lack thereof — is tied to larger economic and social forces. “There's a perfect correlation between poverty and danger,” said Beth Osborne, director of Transportation for America, a Smart Growth America project. A report SGA issued last year found that those living in the lowest-income census tracts are 3.3 times more likely to die in a roadway collision than those living in the highest-income areas. Low-income neighborhoods experience more than 30% of all pedestrian deaths, according to the 2022 SGA report. Black or African American pedestrians are twice as likely to be killed as White pedestrians.
Black and Latino pedestrians face higher risk of death
A study published this year in the American Journal of Public Health looking at pedestrian safety in the U.S. between 2010 and 2019 found “a significant relationship between structural racism via historical redlining and contemporary, neighborhood-level inequities in pedestrian fatalities across the United States.”
The pandemic only exacerbated those inequities, the SGA report says, noting that “Low-income communities are significantly less likely to have access to parks and other opportunities for safe recreational walking and are less likely to have sidewalks, marked crosswalks, and street design to support safer, slower speeds.”
Smart Cities Dive’s analysis of fatal pedestrian accident data shows that even in communities that have lower overall pedestrian death rates, people of color and people in low-income communities are killed at a higher rate than other residents. This article, the first of a three-part series, looks at three cities working to address the disparities as they aim to reduce pedestrian deaths overall. Part 2 looks at the geographic disparity in pedestrian death rates: Recent data show that Sun Belt cities experience more pedestrian deaths than Northern cities. Part 3 looks at federal- and state-level barriers that frustrate city and regional leaders working to reduce deaths, as well as some national and international efforts to move the needle.
Atlanta tackles ‘communities of concern’
Pedestrian fatalities in the city of Atlanta more than doubled in two years, from 14 in 2020 to 36 last year, according to data Smart Cities Dive analyzed, and it has the 10th-highest pedestrian death rate among large U.S. cities. In this city of half a million people, Black and African American residents are 48% of the population, according to the most recent Census Bureau data, and the city’s poverty rate is 18.5%, well above the national poverty rate of 11.5%.
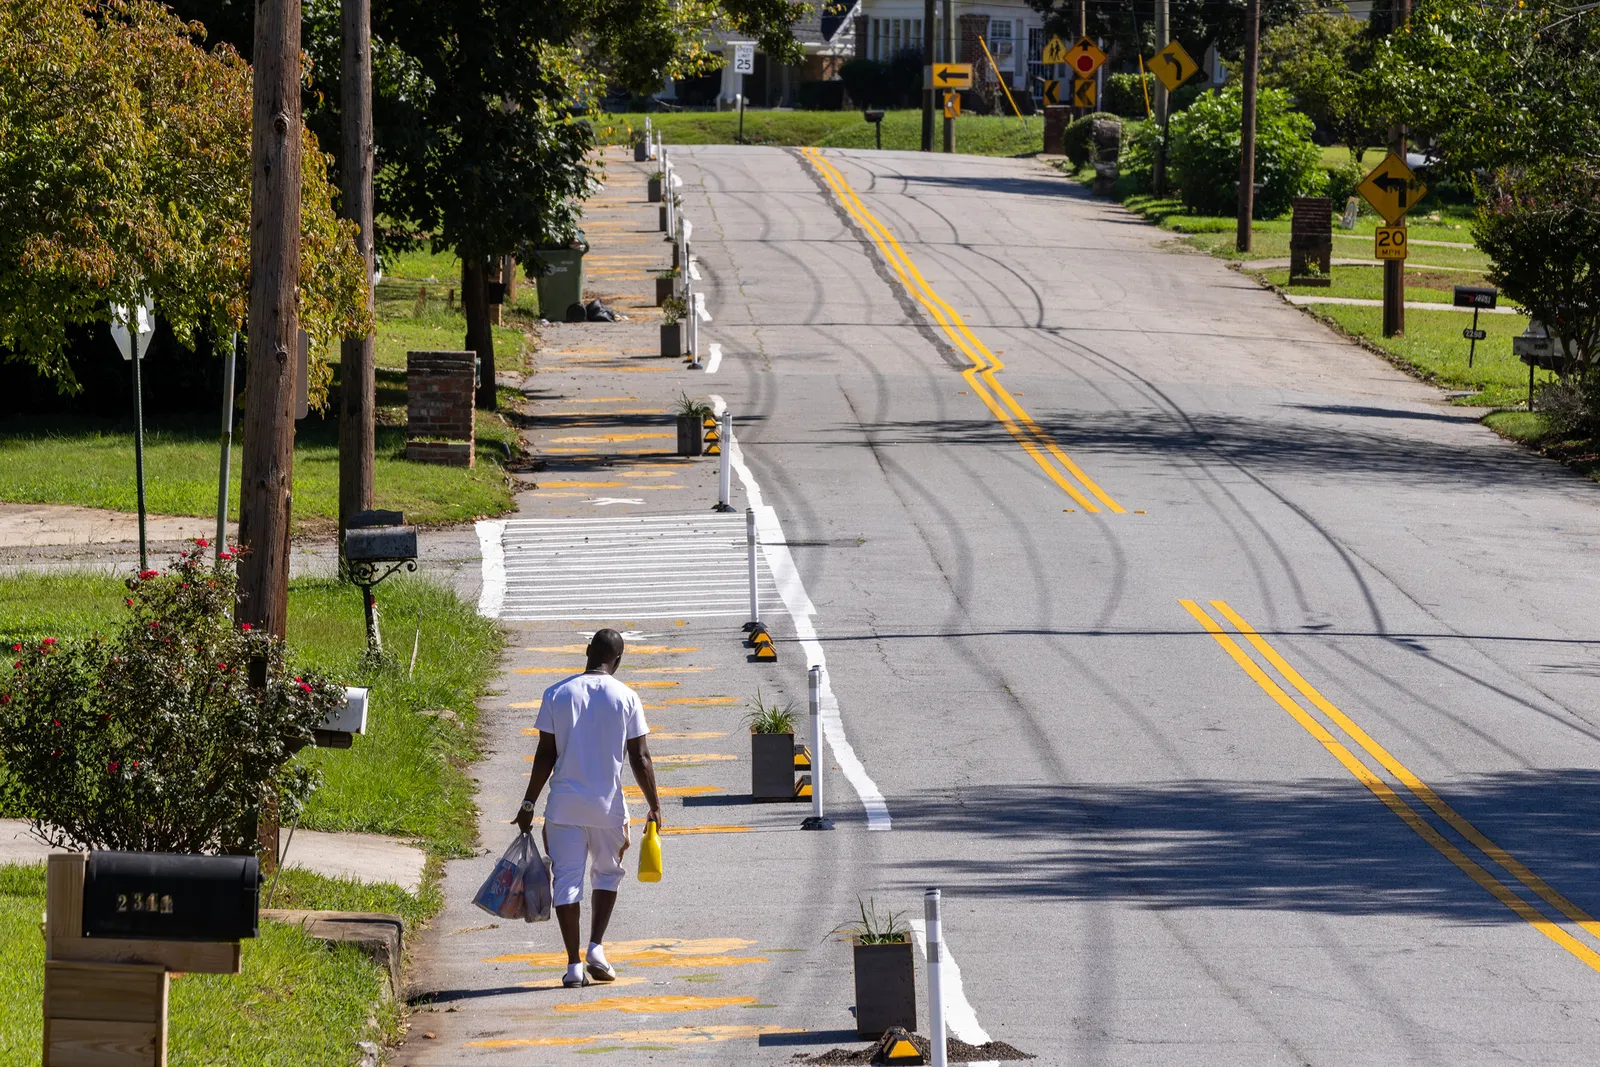
Sidewalk infrastructure is lacking in many Atlanta communities, particularly those where there’s a “huge reliance” on walking, biking and public transit, said Betty Smoot-Madison, deputy commissioner of strategy and planning for the city. Smoot-Madison previously was director of mobility planning for the Atlanta Department of Transportation. The city uses data on race, income, age, single-parent households, homes with school-age children and other factors to identify Vision Zero “communities of concern,” she explained. Vision Zero is an initiative to eliminate deaths and serious injuries among all road users based on the principle that humans make mistakes, thus roads should be designed and managed with that in mind.
In 2020, the Atlanta DOT launched the Transportation Safety Leaders Academy to engage and educate community members on “how government works and how they can become champions within their communities” by bringing in resources to improve road safety, Smoot-Madison said. The program included a five-week training session for which members received a stipend, she said. After participating in the academy, residents in the Adams Park neighborhood, which Atlanta DOT identified as a community of concern, won a Bloomberg Philanthropies grant for an asphalt art installation to connect sidewalks and improve pedestrian safety near an elementary school, bus stop and local businesses.
Despite such efforts, Smoot-Madison admits that “we have a lot of catching up to do as a city, especially when it comes to pedestrian accommodations.”
Some of the changes the city wants to make aren’t within its control because many of Atlanta’s streets are owned by the state of Georgia, she said. The Atlanta DOT is conducting workshops with the Georgia Department of Transportation to review “state policies that have been around and on the books for a long time and generally are geared towards cars and the movement of cars,” she said.
Chicago engages and educates communities
Chicago was the third-safest city for pedestrians on a per-population basis in 2022: It lost 46 pedestrians to traffic crashes last year, according to the city of Chicago and Smart Cities Dive analysis, following a spike in 2021 of 60 fatalities. But that number masks a more complex story of pedestrian risk. Romina Castillo, director of outreach and engagement at the Chicago Department of Transportation, described Chicago as “a very segregated city.” Its deadliest neighborhoods for pedestrians are mostly in the city’s West Side, Southwest and South Side, she said. Those parts of the city have higher poverty levels and more Black and Hispanic residents than the North and East sides.
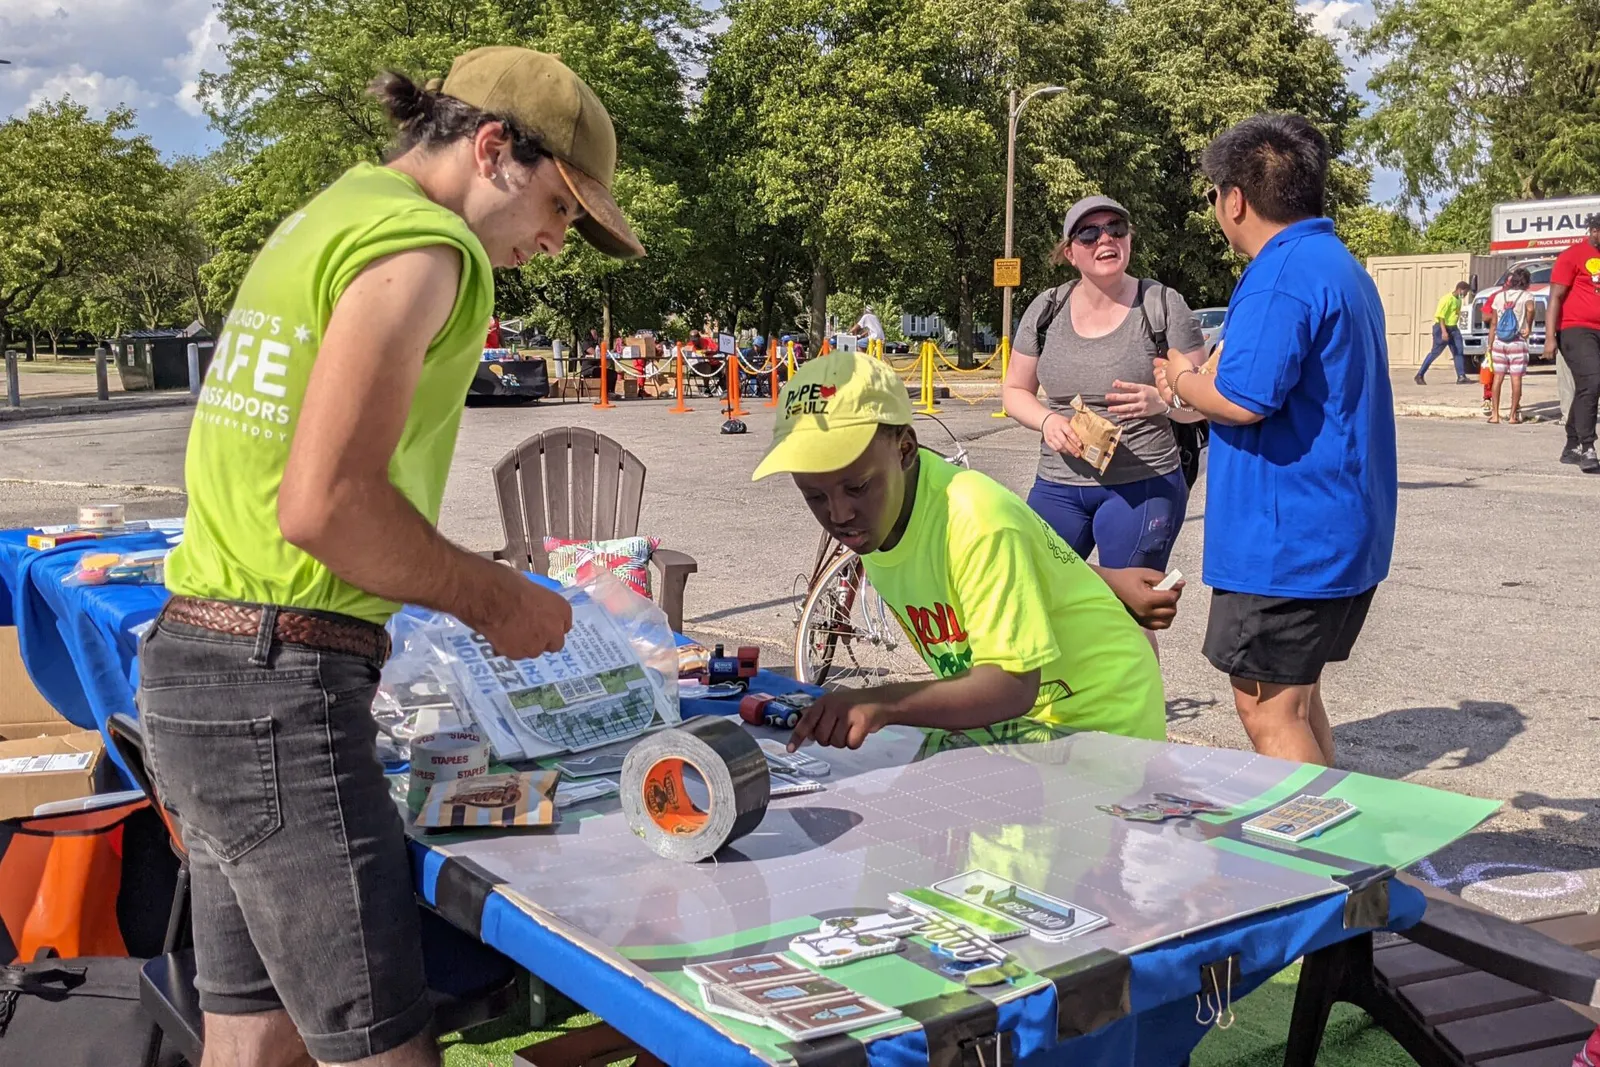
Since 2001, CDOT has engaged with school children and seniors to educate them on pedestrian and bicycling safety through an ambassadors program. The city also committed to a Vision Zero program and in 2017 established a Vision Zero action plan. “What’s key is developing strong relationships with community leaders and everyday residents to best understand what their mobility priorities are,” said Michael Kent, Vision Zero coordinator at the Chicago DOT.
Kent said that reducing speed limits and adding curb extensions to slow right turns at intersections have been effective at slowing traffic, but he also takes a broader view of road safety. “Having safe streets is directly related to myriad other issues,” he said, including land use, the economy, social issues, “and 100 other factors that ultimately influence the behaviors that people make on the roads.”
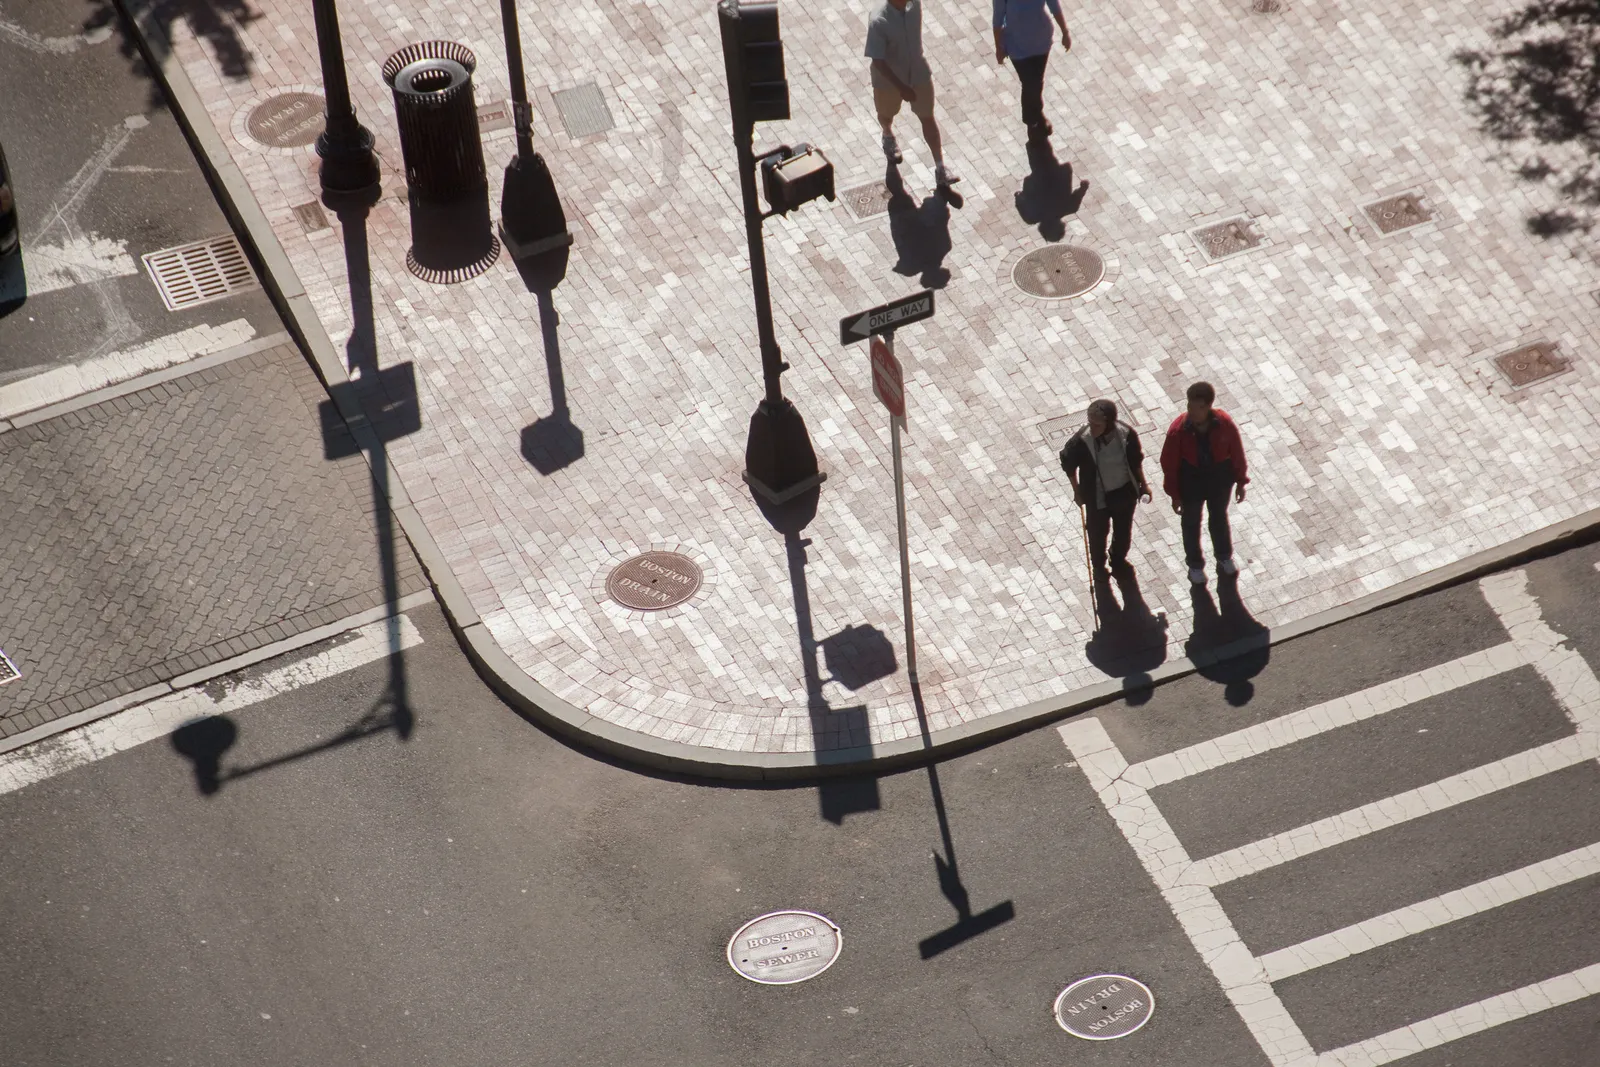
Boston is safest for pedestrians, but disparities persist
For pedestrians, the safest large city in the U.S. is Boston. The city of nearly 700,000 people is steeped in history. First settled by Europeans around 1630, Boston has many streets that remain crooked and narrow, limiting car speeds and increasing walkability. It’s also one of the most traffic-congested cities in the world, according to Inrix.
In 2022, five pedestrians were killed in Boston traffic, according to Smart Cities Dive’s analysis. From 2012 to 2022, Boston recorded 63 pedestrian fatalities, fewer than the number who died in Memphis, Tennessee, just last year. Brendan Kearney, co-executive director of WalkMassachusetts, explained that many of Boston’s streets are “not big, wide, fast-moving streets.” And because many people in the city walk, bike and use public transit to get around, drivers are accustomed to watching for other road users, he said.
As far back as 2001, Boston published pedestrian safety guidelines for residential streets, following “a long history of implementing strategies to improve pedestrian safety,” the document says. The city provides an online dashboard with crash and fatality data for pedestrians and bicyclists, which it updates monthly.
But Boston also has a long history of restrictive, race-based real estate covenants and redlining, followed by “White flight” to the city’s expanding suburbs. The city ranks as the 20th-most-segregated U.S. city with a population over 200,000, according to an analysis of 2020 census data from the Othering and Belonging Institute at the University of California, Berkeley.
Last year, 71% of pedestrian fatalities in Boston occurred in environmental justice communities, which the state defines in terms of median household income, percentage of minority population and percentage of households identifying as speaking English less than "very well."
In a 2021 Streetsblog analysis of 210 car crashes in Massachusetts between 2018 and 2020 that resulted in a pedestrian or bicyclist death, 25% took place in communities with an above-average Black or African American population. “It's places that have experienced disinvestment, places that historically have been redlined,” where pedestrian fatalities are highest, Kearney said. “Now, what's the next step? How are we going to pay attention to these problems and fix them and invest in the injustices of the past?”


